Diffusion Tubes - Nitrogen Dioxide (NO2)
Click on the red graph line, to see a graph of monthly data

Return to map
or click on one of the Alternative views on the right hand menu.
Please note that all data presented (both tabular and graphical) is UNCORRECTED for tube bias. Following completion of the co-location studies underway at 3 monitoring sites containing chemiluminescent analysers within Swansea the local bias correction factor for specific years will be specified below FOR END USER CORRECTION. These local bia factors will be updated on an annual basis and should ONLY be applied to the annual mean for the year under consideration eg uncorrected annual mean (Jan - Dec = 65.5ug/m3 - corrected for tube bias 65.5 * 0.84 = 55.02ug/m3.) The bias corrected annual mean is therefore 55.02ug/m3.
These bias correction factors should NOT be applied on a monthly basis.
2006 bias correction = 0.84
2007 bias correction = 0.84
2008 bias correction = 0.81
2009 bias correction = 0.84
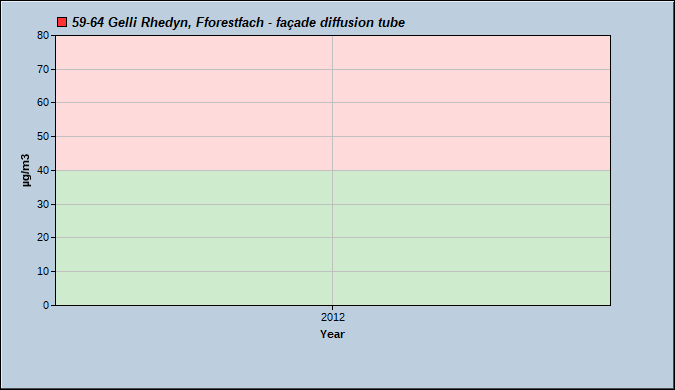
The graph above shows the annual or monthly uncorrected average nitrogen dioxide (NO2) pollution concentrations at the given location. These results are updated on a monthly basis following the laboratory analysis results being received. The graph is colour banded to reflect the current EU objective level for nitrogen dioxide is 40 μg/m3 measured as an annual average to be achieved by 2010:-
Key
Red - Exceeding 40 μg/m3
Green - Under 40 μg/m3
