
City & County of Swansea, 100023509
Welcome
To see summary data quickly with links to all parts of the site click on "summary data for all sites" underneath the map animation section to the left of the page.
ALL CARBON MONOXIDE, SULPHUR DIOXIDE AND HYDROGEN SUPHIDE ANALYSERS HAVE BEEN SWITCHED OFF ON THE 1ST APRIL 2010 TO MAKE SAVINGS AT THE SWANSEA AURN AND MORRISTON GROUNDHOGS . Suplhur dioxide readings will continue to be made at the St Thomas DOAS monitoring station. Should you wish historical data on the above pollutants then please email pollution@swansea.gov.uk
The Morfa Groundhog site was decomissioned during May 2010. Historic data is available.
Please note that should you be browsing this website to obtain meteorological data for an Air Quality Impact Assessment or similar then we have boundary scaling data and climatological datasets available from a 30m meteorological mast at Cwm Level Park, Landore that do not form part of this website. Please contact pollution@swansea.gov.uk should you wish these datasets be forwarded to you.
Ifyou are requesting data (in any format i.e. csv or pdf) please ensure thatinfo.swansea.airqualitydata.com is added to your email systems"whitelist". If not, you may find that the emails are either notdelivered or placed in your "junk" or "spam" folders.
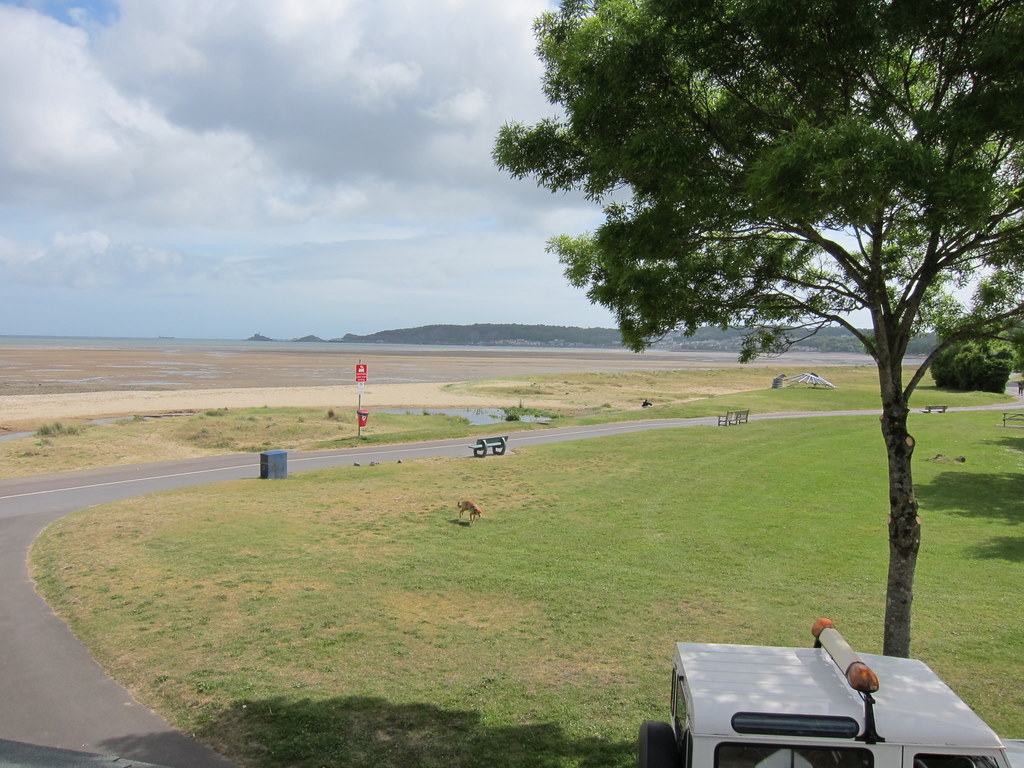
A new meteorological monitoring station (Swansea Bay) has been established within 20m of the Swansea Bay foreshore at Blackpill during May 2010 to provide high quality meteorological data to assist with a major EU funded study into the bathing water quality within Swansea Bay.
The PM10 FDMS at the Morriston Groundhog has been removed from site due to on going data quality issues and replaced with a MetOne BAM1020 PM2.5 unit. Valid data capture commenced from the Bam1020 PM2.5 unit at 14:00 14th January 2016.
Real-time NOx measurements commenced on the 20th June 2014 at 07:15 GMT from a monitoring location outside Station Court, High Street, Swansea. Inclusion of the data stream on this website will be completed as soon as possible. Should you require this data please email pollution@swansea.gov.uk. In the meantime the data can be viewed on the Welsh Air Quality forum website at www.welshairquality.co.uk
An easy to understand symbol driven system (to the right) will take you quickly to the chosen item/feature for that site. Please use the symbol key above these new features to identify the area of interest. In addition links to new data feeds such as the AQ500 Wind Profiler are now live (see below the symbols/station listings)
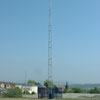
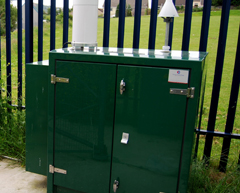
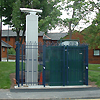
Swansea has an established programme of automatic and continuous air quality monitoring dating back to 1994. The City & County of Swansea has declared the Swansea Air Quality Management Area 2010 that encompasses the areas of Hafod, Sketty and Fforestfach during August 2010. Currently, there are 4 air quality stations (two with basic meteorological data), one 30 metre meteorological mast, one 9m meteorological mast on Swansea bay foreshore at Blackpill, one street canyon meteorological monitoring station and one AQ500 SODAR (wind profiler) providing data to these pages. Additionally, real-time PM10 (dust) data is available from 10 locations in Swansea - mainly around busy junctions.
This website is intended to be an online resource of near real-time air quality data and meteorological data, not only for Swansea residents but also for students and medical health professionals alike.
An index has been created to indicate the number of days Swansea and the individual sites are within the Low/Medium/high and Very High categories - this data is available for the current year as well as previous years.
All passive nitrogen dioxide diffusion tube measurements are now available on line for both historical (indicated as grey) and current measurement sites. Please see the bias correction factor to be applied to the annual mean for the year of interest.
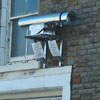
A live traffic cam has been provided to monitor traffic flows within Neath Road, Hafod - please see the Hafod Opsis DOAS station information and look under the link "see monitoring station in action". You will need to install the Axis media plugin to view the live images for which Administrator rights will be needed on Windows XP etc.
The site now has Accessibility Options targeted to comply as closely as possible with the AA standard.
Key to symbols
BANDED DATA
BASE AQ DATA
CURRENT ALERTS
WEB CAM INSTALLED
MET DATA
ANNUAL TOTALS
MORE INFORMATION
UV INDEX MEASURED
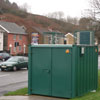
The Monitoring Stations
Click the appropriate icon to find out information about each station. See the key above for an explanation of the icons used.